How does FireSignal work? Satellite fire detection in Europe, explained
FireSignal shows active wildfires across Europe on a live map, based on thermal detections by NASA satellites. This page explains where the data comes from, how current it is, what the symbols mean, and where the limits of satellite detection lie.
The satellites
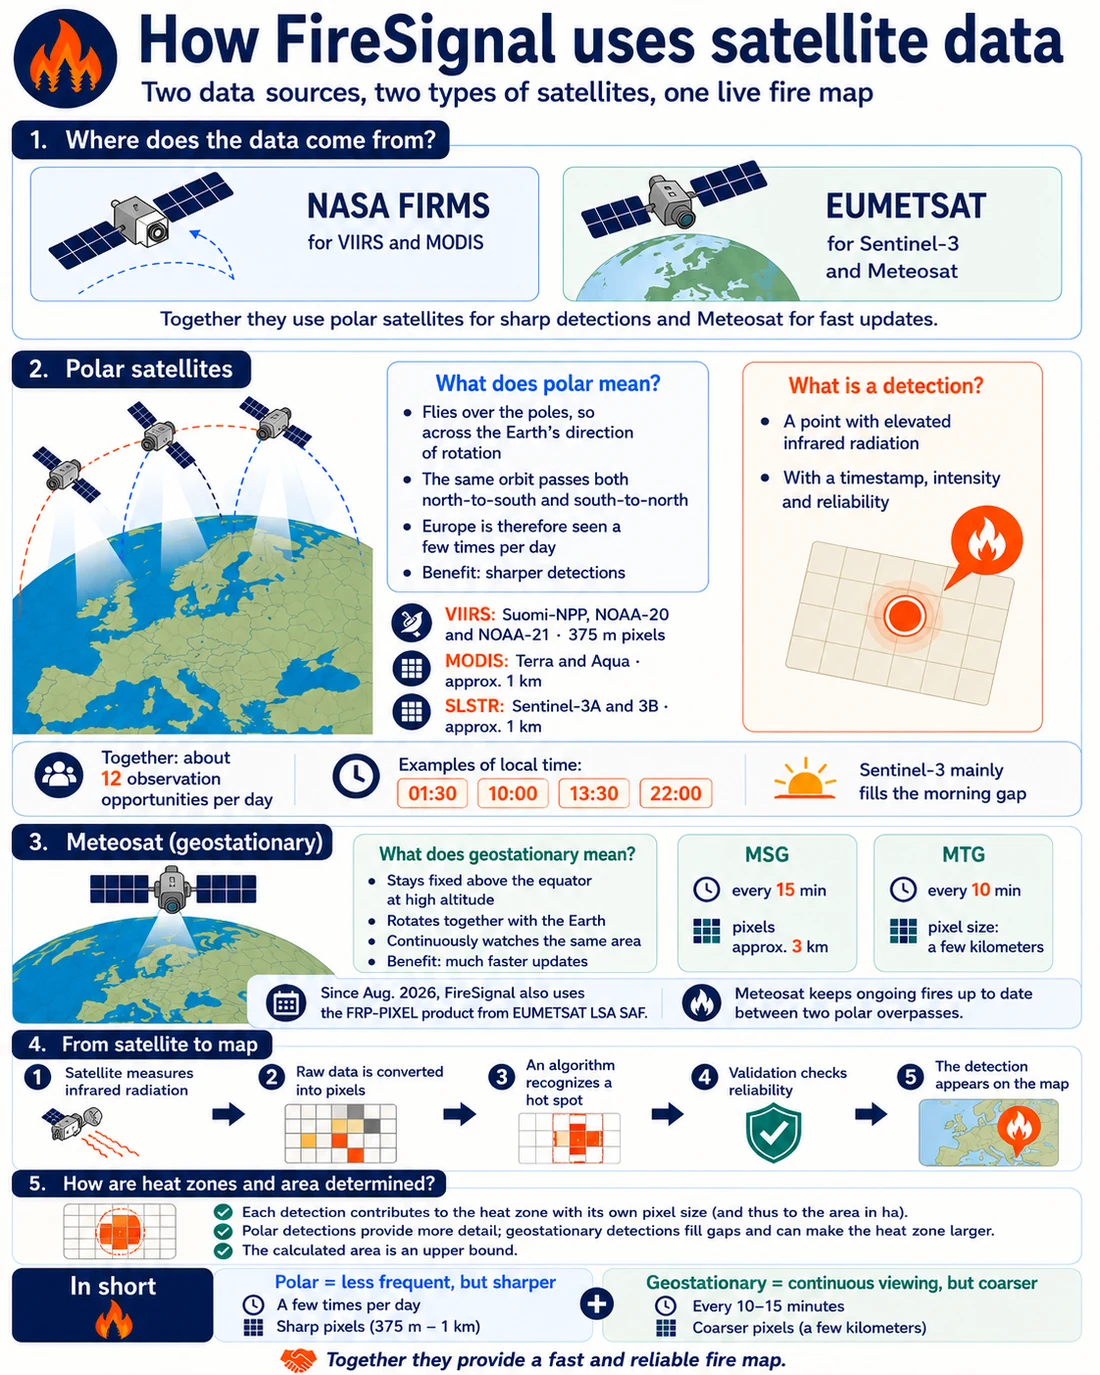
The data comes from two organisations: NASA's FIRMS programme for VIIRS and MODIS, and EUMETSAT for Sentinel-3 and Meteosat. Seven polar satellites scan the earth with infrared sensors. Three carry the modern VIIRS instrument (Suomi-NPP, NOAA-20 and NOAA-21, 375-metre pixels), two the veteran MODIS (Terra and Aqua, roughly 1-kilometre pixels), and since August 2026 Copernicus Sentinel-3A and 3B contribute as well (SLSTR, also about 1 kilometre). Each satellite passes over Europe about twice a day, spread across day and night; together they give some twelve opportunities per day, around 10:00, 13:30, 22:00 and 01:30 local time. Sentinel-3 mainly fills the morning gap. A spot with elevated infrared radiation becomes a "detection": a point with a timestamp, an intensity and a confidence level.
Meteosat (geostationary). Alongside the polar satellites, FireSignal has used the FRP-PIXEL product from EUMETSAT LSA SAF since August 2026. The Meteosat weather satellite hovers over the equator and therefore watches Europe without interruption. Two generations run side by side: the older MSG delivers a measurement every fifteen minutes at a pixel size of roughly 3 kilometres, the new Meteosat Third Generation every ten minutes at pixels of about 2 kilometres over Europe. Meteosat mainly keeps existing fires current: between two polar overpasses it refreshes the last-detected time and the measured intensity. In addition, a large fire starting just after a polar overpass can reach the map on Meteosat alone; it is then marked as provisional until a polar satellite confirms it, and disappears again if that confirmation never comes. Heat zone and area are always derived from the sharpest detections available, which in practice means the polar data.
From detection to fire
Single detections mean little on their own, so every fifteen minutes FireSignal clusters them into events: groups of detections that belong together in space and time. An event has a heat zone (the measured heat area, an upper bound), an intensity profile and a timeline, and leaves the live map once nothing has been measured for 48 hours. The time slider keeps a week of history visible, and the statistics page keeps thirty days.
The symbols on the map
FRP (Fire Radiative Power, in megawatts) is the measured radiative intensity: how fiercely the fire was burning at the moment of the overpass. The colour scale runs from smouldering yellow to very intense dark red.
Aerial photo. Zoom in and switch on the Aerial photo button to replace the map with current aerial imagery from the national mapping agencies, at 8 to 50 centimetres per pixel. This shows what is actually on the ground: buildings, roads, forest edges and clearings. The source is selected automatically based on the country in view (including PDOK, IGN, Geobasis NRW, PNOA and Geoportal.gov.pl); in areas without an open source the regular map stays. Note that aerial photos are still images, months to years old, not live imagery of the fire.
Smoke (live). The Smoke button overlays the current image from the Meteosat weather satellite. It watches Europe continuously and delivers a new frame every fifteen minutes, so during an active fire you actually see the plume move. The arrows step back in quarter-hour intervals up to 24 hours. The trade-off is sharpness: these frames have kilometre-scale pixels, against 250 metres for the daily images under Satellite image. Zoomed out across a region Meteosat is most useful; zoomed in on a site the polar daily images are. Imagery © EUMETSAT.
Replaying a fire
For larger fires, the detail panel has a play button below the timeline. It replays the fire from the first detection to the last: the heat zone grows along with it, showing the order in which the area filled up and which way the fire moved. You can also drag the slider. The view is cumulative - measured heat does not disappear, so the area only grows. Detections are removed after thirty days; if a fire ran longer than that, the panel says the beginning is missing.
How current is this?
Honest answer: more current than news reports, but not a live feed. Between the satellite overpass and the map sit NASA's processing time (usually half an hour to three hours) plus at most fifteen minutes of our own pipeline. Between two overpasses nobody sees anything, including us; and heavy cloud or thick smoke can block the view. The "latest pass" panel on the map shows, per satellite, when the newest data arrived and when the next overpass is expected.
Why something burns that is not a wildfire
Satellites measure heat, not cause. Refinery flares, steel plants, waste incineration and crop residue burning produce signals much like wildfire. FireSignal filters these with several layers: known industrial sources, recurring heat at the same spot, sources that stay in exactly the same place for days, structurally weak signals, detections on open water, and a curated list of known offenders. On top of that, solar farms and greenhouses from OpenStreetMap are subtracted: panels and glass reflect sunlight so strongly that the satellite registers them as warm. New sources can be visible for a few days before the filters catch on; click a suspicious dot and the detail panel shows what was measured.
For campsites, land managers and organisations
FireSignal Locations is the professional service on top of this map: automatic e-mail alerts whenever satellites detect fire within a configurable radius of your sites, with daily summaries, a dashboard with distance history and your locations shown on the map. Built for organisations with multiple outdoor locations, such as campsite chains and nature managers. Interested in a pilot? Mail hallo@1338.nl. See how FireSignal Locations works and what it costs →
Is it working right now?
The status page shows, per satellite, when data last arrived and whether anything is currently down. It also lists earlier outages.
Frequently asked questions
Why can't I see a fire that is in the news?
Three possible reasons: the fire is too small or too brief for a satellite pixel (especially between two overpasses), cloud or smoke blocked the view, or the fire was contained before a satellite came over. Satellite detection is a safety net with gaps of a few hours, not camera surveillance.
Why is there a "fire" at a factory or refinery?
Industrial flares are hot enough to register as detections. FireSignal's filters usually recognise recurring sources within a few days and then remove them retroactively. If you spot a persistent one, that is valuable feedback.
Is the stated area the burnt area?
No. The hectares are the heat zone: the area within which heat was measured over recent days. For large fires this approximates the fire zone; for small or freshly detected fires it can overestimate considerably, since one pixel already covers tens of hectares.
How quickly does a new fire appear on the map?
Usually within half an hour to three and a half hours of a satellite seeing it: NASA's processing time plus at most fifteen minutes of our own. The limiting factor is the overpass schedule: between passes there is no observation.
Can I get automatic alerts for fires near my location?
For organisations with multiple sites there is FireSignal Locations, with e-mail alerting within a configurable radius. See the section for organisations above, or mail hallo@1338.nl.
Where does the data come from, and may I use FireSignal?
Fire data © NASA FIRMS (publicly available) and © EUMETSAT (Meteosat FRP via LSA SAF, Sentinel-3 via the Data Store), base map © OpenStreetMap & CARTO, place names © GeoNames, wind by Open-Meteo. The map is free to use and share; for structural reuse or embedding, get in touch via 1338.nl.
Is this an official alert system?
Emphatically not. FireSignal is an information tool. In case of threat, always follow official channels: 112, FR-Alert, NL-Alert or your local equivalent, and the instructions of emergency services.
Why FireSignal exists
FireSignal was born in July 2026, when its maker and his family were camping near Carcans and had to evacuate from what became France's largest wildfire in fifty years. Reliable, readable information about where the fire actually was proved nearly impossible to find. This map is the answer: the best public satellite data, filtered and explained, for everyone.